Reasons Behind Why Does APAC Holds Largest Share in Micromobility Telematics Market
Some of the key factors propelling the micromobility telematics market expansion are the growing need for first- and last-mile transportation, substantial expenditures on micromobility, and rising demand for micromobility services. Due to all these factors, the market is projected to reach $13,010.4 million by 2030. The market is anticipated to grow quickly because of the quick integration of locking mechanisms, network services, smartphone connections, and fleet optimization into such services. Market participants are creating increasingly sophisticated software as micromobility becomes widespread. As a result, throughout the forecast period, the software market is expected to grow at the highest rate. The software also primarily consists of device drivers, operating systems (OS), voice recognition tools, and application programming interfaces (API), which offer connection, navigation, and security and safety solutions.
Being stopped on the road during traffic congestion leads to lost productivity and working hours. Not only does it destroy individual productivity, but it also affects company productivity. This problem is solved by micro-mobility transportation, including e-bikes and electric scooters, which offer a more portable mode of transportation and help lower the number of automobiles on major highways.
The majority of micromobility users choose alternate routes because they are not permitted on major thoroughfares, which reduces traffic. E-scooters and e-bikes allow users to avoid traffic and get to their destination more rapidly.
By providing mobility alternatives for shorter distances, micromobility services play a crucial role in bridging the first- and last-mile mobility gap, which is a fundamental element in the market's expansion. These services are often utilized for trips that span less than 5 kilometers.
Additionally, these services are frequently provided using a dock-less or station-less paradigm, allowing customers to return the car wherever it is most convenient for them, further facilitating first- and last-mile travel.
The APAC has the largest market share for micromobility telematics services globally. High investments and the emergence of technological start-ups in APAC are contributing to the market's expansion. To acquire the first-mover advantage, the players are concentrating on offering affordable micromobility services
Market participants are creating increasingly sophisticated software as micromobility becomes widespread. As a result, throughout the forecast period, the software market is expected to grow at the highest rate. The software also primarily consists of device drivers, operating systems (OS), voice recognition tools, and application programming interfaces (API), which offer connection, navigation, and security and safety solutions.
Being stopped on the road during traffic congestion leads to lost productivity and working hours. Not only does it destroy individual productivity, but it also affects company productivity. This problem is solved by micro-mobility transportation, including e-bikes and electric scooters, which offer a more portable mode of transportation and help lower the number of automobiles on major highways.
The majority of micromobility users choose alternate routes because they are not permitted on major thoroughfares, which reduces traffic. E-scooters and e-bikes allow users to avoid traffic and get to their destination more rapidly.
By providing mobility alternatives for shorter distances, micromobility services play a crucial role in bridging the first- and last-mile mobility gap, which is a fundamental element in the market's expansion. These services are often utilized for trips that span less than 5 kilometers.
Additionally, these services are frequently provided using a dock-less or station-less paradigm, allowing customers to return the car wherever it is most convenient for them, further facilitating first- and last-mile travel.
The APAC has the largest market share for micromobility telematics services globally. High investments and the emergence of technological start-ups in APAC are contributing to the market's expansion. To acquire the first-mover advantage, the players are concentrating on offering affordable micromobility services
Malaysia Micromobility Market Will Grow at a High Pace
Due to their low costs and capacity to offer more convenience than traditional mobility services, micromobility services are becoming increasingly popular in Malaysia for last- and first-mile commuting. These services are typically offered using a station-less or dock-less paradigm, allowing clients to drop off their cars wherever it is most convenient. For instance, due to their capacity to offer affordable transportation, bike-sharing programs have seen a significant increase in popularity across the nation in recent years. In contrast to owning a personal car, which often involves significant investments due to fuel costs, insurance costs, maintenance costs, and parking prices, micromobility services are quite economical.
Users of micromobility services can pay only for the time they actually utilize the service, leaving the management of extra expenditures like gasoline, insurance, parking, and maintenance to the mobility service providers. The Malaysian micromobility market is growing due to shared micromobility services' affordability and convenience.
The development of technology is a major trend in the Malaysian micromobility sector. The micromobility service is built on mobile applications, where users and service providers connect to arrange trips and settle associated bills. A number of platforms have been introduced as a result of ongoing technological advancements, making it easier to access services.
One such breakthrough is cloud sharing, which offers consumers low-cost access to computer resources relating to networks, software, storage, databases, and analytics. The IoT also contributes to process optimization by making it possible to track and monitor vehicles, manage routes, and assess potential issues from a distance.
Owning a private automobile necessitates a significant financial commitment, which is made up mostly of the costs of the vehicle, fuel, parking, maintenance, and insurance. In this way, consumers of micromobility services are able to make use of the benefits of possessing a personal vehicle without having to actually purchase one.
Only on the basis of their use may users make payments. Additionally, the suppliers of mobility services cover extra expenditures, including those for parking, gasoline, maintenance, and insurance.
In contrast to owning a personal car, which often involves significant investments due to fuel costs, insurance costs, maintenance costs, and parking prices, micromobility services are quite economical.
Users of micromobility services can pay only for the time they actually utilize the service, leaving the management of extra expenditures like gasoline, insurance, parking, and maintenance to the mobility service providers. The Malaysian micromobility market is growing due to shared micromobility services' affordability and convenience.
The development of technology is a major trend in the Malaysian micromobility sector. The micromobility service is built on mobile applications, where users and service providers connect to arrange trips and settle associated bills. A number of platforms have been introduced as a result of ongoing technological advancements, making it easier to access services.
One such breakthrough is cloud sharing, which offers consumers low-cost access to computer resources relating to networks, software, storage, databases, and analytics. The IoT also contributes to process optimization by making it possible to track and monitor vehicles, manage routes, and assess potential issues from a distance.
Owning a private automobile necessitates a significant financial commitment, which is made up mostly of the costs of the vehicle, fuel, parking, maintenance, and insurance. In this way, consumers of micromobility services are able to make use of the benefits of possessing a personal vehicle without having to actually purchase one.
Only on the basis of their use may users make payments. Additionally, the suppliers of mobility services cover extra expenditures, including those for parking, gasoline, maintenance, and insurance.
 In such a scenario, electric rickshaws are the perfect option, as it offers convenient mobility services at low cost. The batteries of these vehicles however need to be charged frequently for their smooth functioning. Most electric vehicles in the country employ slow charging systems that take up to eight hours. This can result in significant revenue loss for people who offer public mobility solutions to people.
In terms of vehicle type, the Indian electric vehicle battery swapping market is divided into commercial vehicle, two-wheeler, and three-wheeler, among which, the three-wheeler division is predicted to account for over 90% share of the market in the years to come. The daily operational hours of these vehicles is increasing, which is why, the popularity of battery swapping technology is rising among customers. These vehicles are majorly utilized for passenger carriage, and run for more than 100 km, on a daily basis. Due to this, they need to be charged quickly, which can be facilitated by the battery swapping technology.
On the basis of service type, the Indian electric vehicle battery swapping market is categorized into subscription model and pay-per-use model, between which, the subscription model is expected to advance at a faster pace during the forecast period. The rising utilization of the battery swapping technology in commercial vehicles is predicted to eventually pave the way for growth of the subscription model. Since electric bus driver have a fairly good idea of how much distance is being covered in how much time, they are expected to be the major users of the subscription model in the years to come.
In conclusion, the demand for the battery swapping technology is rising in India due to the increasing penetration of electric three-wheelers, favorable government policies, benefits offered by the technology.
In such a scenario, electric rickshaws are the perfect option, as it offers convenient mobility services at low cost. The batteries of these vehicles however need to be charged frequently for their smooth functioning. Most electric vehicles in the country employ slow charging systems that take up to eight hours. This can result in significant revenue loss for people who offer public mobility solutions to people.
In terms of vehicle type, the Indian electric vehicle battery swapping market is divided into commercial vehicle, two-wheeler, and three-wheeler, among which, the three-wheeler division is predicted to account for over 90% share of the market in the years to come. The daily operational hours of these vehicles is increasing, which is why, the popularity of battery swapping technology is rising among customers. These vehicles are majorly utilized for passenger carriage, and run for more than 100 km, on a daily basis. Due to this, they need to be charged quickly, which can be facilitated by the battery swapping technology.
On the basis of service type, the Indian electric vehicle battery swapping market is categorized into subscription model and pay-per-use model, between which, the subscription model is expected to advance at a faster pace during the forecast period. The rising utilization of the battery swapping technology in commercial vehicles is predicted to eventually pave the way for growth of the subscription model. Since electric bus driver have a fairly good idea of how much distance is being covered in how much time, they are expected to be the major users of the subscription model in the years to come.
In conclusion, the demand for the battery swapping technology is rising in India due to the increasing penetration of electric three-wheelers, favorable government policies, benefits offered by the technology.
E-Rickshaws Have Won in the Race for Electric Mobility in India
In India, the electric car revolution has already impacted people's lives. You might not have noticed because you reside in affluent areas, but little battery-powered "e-rickshaws" has become very popular. But this industry is mainly unstructured. According to data from the SIAM, only 1823 units were sold in July 2022. However, according to the FADA, which utilizes registration information from the VAHAN portal run by the Ministry of Road Transport and Highways, 25,984 such vehicles—counting passenger e-rickshaws solely—were bought and registered in India in July. India is the third-largest emitter of carbon dioxide globally, contributing around 6% of all fuel-related CO2 emissions worldwide. Therefore, to make expensive electric rickshaws accessible and displace their traditional counterparts, the Indian government emphasizes offering benefits through taxes and subsidies.
It's enough of that. The statistics reveal that there are more than a million e-rickshaws transporting people around India. If you travel quite a bit, you'll find that these little, rickety cars are more common towards the north. The plains' flatness and the pressing necessity for local transit account for some of this. And these little cars have already had a big economic impact.
The unorganized, local businesses operating in the market are largely to blame for the industry's rapid growth in demand for electric rickshaws in India. These shady actors import axles, battery management systems, and motors for vehicles, then assemble them locally.
The growing need for affordable mobility for first- and the last-mile connection is a key growth factor for electric rickshaw demand. The sharing of three-wheelers is an efficient and practical economic option for commuters. Electric rickshaws are frequently employed in cities around the nation for first- and last-mile connections since they have no exhaust emissions.
These three-wheeled electric cars aid commuters fill service gaps in the public transportation system. An electric rickshaw service costs $0.14 per person per kilometer (km). If the rickshaw is shared, this is the fare. The cost is around $0.21 for a 5 km journey in a rickshaw.
The driver makes about $1.70 (INR 120) for each trip to and from the location with four passengers. The finest affordable shared method of public transportation in the nation for last-mile connection can therefore be considered electric rickshaws.
India is the third-largest emitter of carbon dioxide globally, contributing around 6% of all fuel-related CO2 emissions worldwide. Therefore, to make expensive electric rickshaws accessible and displace their traditional counterparts, the Indian government emphasizes offering benefits through taxes and subsidies.
It's enough of that. The statistics reveal that there are more than a million e-rickshaws transporting people around India. If you travel quite a bit, you'll find that these little, rickety cars are more common towards the north. The plains' flatness and the pressing necessity for local transit account for some of this. And these little cars have already had a big economic impact.
The unorganized, local businesses operating in the market are largely to blame for the industry's rapid growth in demand for electric rickshaws in India. These shady actors import axles, battery management systems, and motors for vehicles, then assemble them locally.
The growing need for affordable mobility for first- and the last-mile connection is a key growth factor for electric rickshaw demand. The sharing of three-wheelers is an efficient and practical economic option for commuters. Electric rickshaws are frequently employed in cities around the nation for first- and last-mile connections since they have no exhaust emissions.
These three-wheeled electric cars aid commuters fill service gaps in the public transportation system. An electric rickshaw service costs $0.14 per person per kilometer (km). If the rickshaw is shared, this is the fare. The cost is around $0.21 for a 5 km journey in a rickshaw.
The driver makes about $1.70 (INR 120) for each trip to and from the location with four passengers. The finest affordable shared method of public transportation in the nation for last-mile connection can therefore be considered electric rickshaws.
Backed by Increasing Government Support, German Autonomous Vehicles Market to Exhibit Substantial Growth in Future
The German fully autonomous vehicles market is predicted to exhibit a CAGR of 20.2% between 2020 and 2030 andattain a valuation of $28.0 billion by 2030, as per the estimates of P&S Intelligence, a market research firm. The German autonomous vehicles market is being driven by the increasing implementation of various government initiatives that encourage the deployment of autonomous vehicles in the country and the rising requirement for a more efficient and safer driving option all over the country. The German government was the first one in the entire world to authorize fully and semi-autonomous driving systems. The government announced its plans to build autonomous driving facilities and infrastructure in the country in December 2016. This was followed by an amendment to the Road Traffic Act in June 2017, which allowed drivers to give away driving controls to autonomous vehicles. As a result, there are many semi-autonomous automobiles (level 1—3) running on German roads today.
In these vehicles, the steering and acceleration/deceleration can be controlled and operated by the vehicle itself but the driver is required to be on board so that in emergency situations, he/she can take over the driving controls. Furthermore, major original equipment manufacturers (OEMs) and technology developers are focusing on developing level 4 and level 5 autonomous vehicles. Moreover, they have got approval from the regulatory bodies for testing driverless automobiles on public roads.
Some cities in Germany have allowed these OEMs to operate pilot fleets in isolated areas for testing the autonomous technology. Regular road traffic will be recreated in these isolated areas for testing the real-time reliability and performance of these vehicles. For example, Charité – Universitätsmedizin Berlin and Berliner Verkehrsbetriebe (BVG) in collaboration with Navya SAS and EasyMile SAS began a pilot projectin March 2018 for testing autonomous shuttle. This shuttle would be tested on Charité’s campus in Berlin.
When vehicle autonomy is taken into consideration, the German autonomous vehicles market is divided into fully autonomous and semi-autonomous vehicles. Of these, the semi-autonomous vehicles had 100% share in the market in the years gone by. However, this will change in the future and the fully autonomous vehicles category will register the highest CAGR in the market between 2023 and 2030, owing to the development of fully autonomous vehicles, which are predicted to hit the market in 2023.
The German autonomous vehicles market is also divided, depending on application, into ride hailing, motor coaches, personal cars, transit buses, and logistics. Out of these, the motor coaches category is predicted to exhibit the highest CAGR in the market in the coming years. This would be because of the rising popularity of shared autonomous vehicles all over the country, on account of the growing consumer preference for these services over the personal ownership of vehicles.
The German government was the first one in the entire world to authorize fully and semi-autonomous driving systems. The government announced its plans to build autonomous driving facilities and infrastructure in the country in December 2016. This was followed by an amendment to the Road Traffic Act in June 2017, which allowed drivers to give away driving controls to autonomous vehicles. As a result, there are many semi-autonomous automobiles (level 1—3) running on German roads today.
In these vehicles, the steering and acceleration/deceleration can be controlled and operated by the vehicle itself but the driver is required to be on board so that in emergency situations, he/she can take over the driving controls. Furthermore, major original equipment manufacturers (OEMs) and technology developers are focusing on developing level 4 and level 5 autonomous vehicles. Moreover, they have got approval from the regulatory bodies for testing driverless automobiles on public roads.
Some cities in Germany have allowed these OEMs to operate pilot fleets in isolated areas for testing the autonomous technology. Regular road traffic will be recreated in these isolated areas for testing the real-time reliability and performance of these vehicles. For example, Charité – Universitätsmedizin Berlin and Berliner Verkehrsbetriebe (BVG) in collaboration with Navya SAS and EasyMile SAS began a pilot projectin March 2018 for testing autonomous shuttle. This shuttle would be tested on Charité’s campus in Berlin.
When vehicle autonomy is taken into consideration, the German autonomous vehicles market is divided into fully autonomous and semi-autonomous vehicles. Of these, the semi-autonomous vehicles had 100% share in the market in the years gone by. However, this will change in the future and the fully autonomous vehicles category will register the highest CAGR in the market between 2023 and 2030, owing to the development of fully autonomous vehicles, which are predicted to hit the market in 2023.
The German autonomous vehicles market is also divided, depending on application, into ride hailing, motor coaches, personal cars, transit buses, and logistics. Out of these, the motor coaches category is predicted to exhibit the highest CAGR in the market in the coming years. This would be because of the rising popularity of shared autonomous vehicles all over the country, on account of the growing consumer preference for these services over the personal ownership of vehicles.
Asia-Pacific Anti-Drone Market to Witness 47.8% CAGR during 2018–2025
According to a report by P&S Intelligence, the Asia-Pacific (APAC) anti-drone market is predicted to generate $2,105.0 million by 2025, and is projected to advance at a 47.8% CAGR during the forecast period (2018–2025). The market is being driven by the rising number of illegal and terrorist activities, surging incidence of security contravention by unauthorized drones, close encounters with commercial aircraft, and drone detection cases. On the basis of platform type, the market is divided into ground-based, unmanned aerial vehicle (UAV)-based, and hand-held. This is majorly because of the early adoption of these drones as compared to other technologies in the APAC region. This being said, players operating in the APAC anti-drone market are also focusing on developing innovative laser anti-drones for countering security threats that are posed by drones. When end user is taken into consideration, the market is classified into government, military & defense, commercial, and others. Out of these, the military & defense industry is predicted to contribute the largest revenue share to the market during the forecast period.
This is because of the significant budget for the defense industry in APAC countries. Within, the region, China is projected to dominate the APAC anti-drone market during the forecast period. In 2017, the country accounted for 35%, which is owing to the fact that the government of the country has invested considerably in technology and armed forces for strengthening defense capabilities. When it comes to defense budget, China is on the 2nd rank in the world, and 7 of the world’s major defense companies are located in China.
This is majorly because of the early adoption of these drones as compared to other technologies in the APAC region. This being said, players operating in the APAC anti-drone market are also focusing on developing innovative laser anti-drones for countering security threats that are posed by drones. When end user is taken into consideration, the market is classified into government, military & defense, commercial, and others. Out of these, the military & defense industry is predicted to contribute the largest revenue share to the market during the forecast period.
This is because of the significant budget for the defense industry in APAC countries. Within, the region, China is projected to dominate the APAC anti-drone market during the forecast period. In 2017, the country accounted for 35%, which is owing to the fact that the government of the country has invested considerably in technology and armed forces for strengthening defense capabilities. When it comes to defense budget, China is on the 2nd rank in the world, and 7 of the world’s major defense companies are located in China. How Do Rising Fuel Prices Propel Sales of LSEVs in APAC?
A steady rise in the sales of electric vehicles has been witnessed of late in India due to the increasing petrol (gasoline) prices. Simultaneously, manufacturers are focusing on making EVs safe and free of the risk of fire. India intends to achieve its EV ambitions through the Fame scheme, which aims to make it easier for people to buy EVs with a total investment of a ginormous INR 10,000 crore! Similar to this national scheme, state governments have launched their EV subsidy programs. For instance, the GEDA initiative of the Gujarat government provides a subsidy of INR 12,000 on electric two-wheelers with a limited speed of 25km/hour to students of class 9th to 12th. In the same way, the FAME scheme allows for a maximum subsidy of INR 20,000 on electric two-wheelers with a maximum of 2 kWh battery capacity and factory price of INR 1.5 lakh.
Moreover, low-speed e-scooters are widely used for B2B purposes, such as delivery services, which are high in demand with the expansion of the e-commerce sector. In fact, fleet operators might be the customer base with the biggest potential for APAC LSEV market players, since, despite the subsidies, EVs, in general, can be expensive for individuals. Thus, OEMs might look to target well-funded e-commerce, parcel delivery, and micromobility service providers.
Similarly, China is experiencing a surge in the traction of low-speed electric cars, the prices of which usually start around $1,600, which is the same as that of an iPhone 12 Pro Max. Moreover, the smaller size (resulting in less parking space requirement) and convenience offered by these LSEVs lead to their increasing demand. According to the Passenger Car Association, in China, more than 6 million electric cars plied in 2020.
Encouraged by the positive signs, OEMs are intensifying their efforts to launch newer, cost-effective LSEV models. For instance, just two months ago, Nissan Motor Co. partnered with Mitsubishi Motors Corp. to soon launch an ultra-small EV in Japan. The model will be based on the minivehicle standard of the country and priced at $11,719 (JPY 1.5 million) in Tokyo. The price includes the subsidies provided by the metropolitan government and central government, of JPY 450,000 and JPY 550,000, respectively.
Nissan will sell the vehicle as Sakura, with the least-expensive model costing around JPY 2.33 million, while Mitsubishi will market it as eK X EV, with a starting cost of about JPY 2.39 million. However, after subtracting the subsidies offered by governments in different prefectures of Japan, people would be able to buy them for around JPY 1.5 million.
Therefore, the demand for LSEVs is rising due to their low cost and no requirement for a license or registration. Essentially, the surging gasoline and diesel prices in the region have been raising people’s concerns regarding the cost of living.
Similar to this national scheme, state governments have launched their EV subsidy programs. For instance, the GEDA initiative of the Gujarat government provides a subsidy of INR 12,000 on electric two-wheelers with a limited speed of 25km/hour to students of class 9th to 12th. In the same way, the FAME scheme allows for a maximum subsidy of INR 20,000 on electric two-wheelers with a maximum of 2 kWh battery capacity and factory price of INR 1.5 lakh.
Moreover, low-speed e-scooters are widely used for B2B purposes, such as delivery services, which are high in demand with the expansion of the e-commerce sector. In fact, fleet operators might be the customer base with the biggest potential for APAC LSEV market players, since, despite the subsidies, EVs, in general, can be expensive for individuals. Thus, OEMs might look to target well-funded e-commerce, parcel delivery, and micromobility service providers.
Similarly, China is experiencing a surge in the traction of low-speed electric cars, the prices of which usually start around $1,600, which is the same as that of an iPhone 12 Pro Max. Moreover, the smaller size (resulting in less parking space requirement) and convenience offered by these LSEVs lead to their increasing demand. According to the Passenger Car Association, in China, more than 6 million electric cars plied in 2020.
Encouraged by the positive signs, OEMs are intensifying their efforts to launch newer, cost-effective LSEV models. For instance, just two months ago, Nissan Motor Co. partnered with Mitsubishi Motors Corp. to soon launch an ultra-small EV in Japan. The model will be based on the minivehicle standard of the country and priced at $11,719 (JPY 1.5 million) in Tokyo. The price includes the subsidies provided by the metropolitan government and central government, of JPY 450,000 and JPY 550,000, respectively.
Nissan will sell the vehicle as Sakura, with the least-expensive model costing around JPY 2.33 million, while Mitsubishi will market it as eK X EV, with a starting cost of about JPY 2.39 million. However, after subtracting the subsidies offered by governments in different prefectures of Japan, people would be able to buy them for around JPY 1.5 million.
Therefore, the demand for LSEVs is rising due to their low cost and no requirement for a license or registration. Essentially, the surging gasoline and diesel prices in the region have been raising people’s concerns regarding the cost of living.
Singapore Micromobility Market Size, Share, and Growth Insights
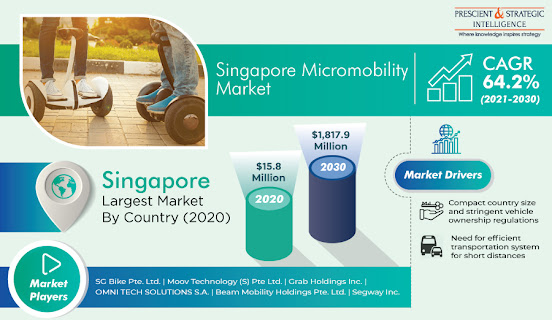 Since traditional mass transit means, such as buses and metros, are overcrowded, they have raised a serious threat of infection during the pandemic. Hence, the Singaporean micromobility market has been impacted positively as people are using these services to maintain social distancing. Further, bus and metro services were curtailed during the lockdowns, which further drove the popularity of such shared mobility services.
The bikes category will grow the fastest in the Singaporean micromobility market in the coming years, based on vehicle type. These vehicles are environment-friendly and cost-effective for usage. Moreover, due to the presence of numerous service providers, Singapore is one of the biggest bike sharing markets in Asia-Pacific (APAC).
Key Findings of Singapore Micromobility Market Report
• Unfavorable vehicle ownership laws boosting micromobility demand
• More people availing of services since COVID-19 outbreak
• E-scooters to be preferred micromobility vehicle in coming years
• Dockless sharing systems preferred by commuters and service providers
• Micromobility effective in bridging first- and last-mile gap
• 5G technology to strengthen micromobility landscape in Singapore
In the past, the first- and last-mile bifurcation dominated the Singaporean micromobility market, on the basis of model. The high population and restrictions on personal vehicles have created a vast unmet need for first- and last-mile transportation, where micromobility has emerged as an efficient solution.
Since traditional mass transit means, such as buses and metros, are overcrowded, they have raised a serious threat of infection during the pandemic. Hence, the Singaporean micromobility market has been impacted positively as people are using these services to maintain social distancing. Further, bus and metro services were curtailed during the lockdowns, which further drove the popularity of such shared mobility services.
The bikes category will grow the fastest in the Singaporean micromobility market in the coming years, based on vehicle type. These vehicles are environment-friendly and cost-effective for usage. Moreover, due to the presence of numerous service providers, Singapore is one of the biggest bike sharing markets in Asia-Pacific (APAC).
Key Findings of Singapore Micromobility Market Report
• Unfavorable vehicle ownership laws boosting micromobility demand
• More people availing of services since COVID-19 outbreak
• E-scooters to be preferred micromobility vehicle in coming years
• Dockless sharing systems preferred by commuters and service providers
• Micromobility effective in bridging first- and last-mile gap
• 5G technology to strengthen micromobility landscape in Singapore
In the past, the first- and last-mile bifurcation dominated the Singaporean micromobility market, on the basis of model. The high population and restrictions on personal vehicles have created a vast unmet need for first- and last-mile transportation, where micromobility has emerged as an efficient solution.
Philippines Micromobility Market Revenue to Cross $13,899.7 Million by 2030
The Philippines micromobility market value stood at $1.9 million in 2020, and it is predicted to surge to $13,899.7 million by 2030, exhibiting a CAGR of 158.6% from 2021 to 2030.
 The market for micromobility in Philippines is driven by:
• Rising Demand for Mitigating Pollution: With the extensive use of fossil-fuel-powered automobiles, air pollution levels are rising at an alarming pace in the Philippines, which is subsequently causing a sharp rise in the prevalence of various lung diseases. As micromobility reduces the requirement for personal vehicle ownership, its increasing adoption is expected to reduce the number of vehicles on the country’s roads, thereby mitigating air pollution.
• Falling Prices of Electric Vehicle Batteries: With the declining prices of the batteries used in electric vehicles, the latter’s adoption is surging in the country. Moreover, this is encouraging many Philippines micromobility market players to adopt electric vehicles. Additionally, several market players are incorporating new-age lithium-ion batteries on account of their greater eco-friendliness, increased running economy, and reduced charging time.
The COVID-19 pandemic has positively impacted the Philippines micromobility market. Owing to the pandemic, people are preferring micromobility over conventional shared mobility, as it will allow them to maintain social distancing. For example, when the stay-at-home orders were lifted in Manila, a large number of people began cycling or walking to work, instead of using public transportation services, such as buses.
The dockless category dominated the Philippines micromobility market during the last few years, and it is predicted to demonstrate the faster growth in the forthcoming years as well, within the sharing system segment. The dockless sharing system is being increasingly adopted by market players on account of the rising preference of customers for it over the docked system. This is because the vehicles deployed via such systems can be picked up and dropped off anywhere.
Key Findings of Philippines Micromobility Market Report
• Soaring demand for greener environment biggest market driver
• Micromobility providing better first- and last-mile connectivity
• Popularity of e-mopeds was highest in past
• Adoption of dockless sharing systems will surge
• Micromobility service providers adopting electric vehicles
• Market players focusing on service expansion
The market for micromobility in Philippines is driven by:
• Rising Demand for Mitigating Pollution: With the extensive use of fossil-fuel-powered automobiles, air pollution levels are rising at an alarming pace in the Philippines, which is subsequently causing a sharp rise in the prevalence of various lung diseases. As micromobility reduces the requirement for personal vehicle ownership, its increasing adoption is expected to reduce the number of vehicles on the country’s roads, thereby mitigating air pollution.
• Falling Prices of Electric Vehicle Batteries: With the declining prices of the batteries used in electric vehicles, the latter’s adoption is surging in the country. Moreover, this is encouraging many Philippines micromobility market players to adopt electric vehicles. Additionally, several market players are incorporating new-age lithium-ion batteries on account of their greater eco-friendliness, increased running economy, and reduced charging time.
The COVID-19 pandemic has positively impacted the Philippines micromobility market. Owing to the pandemic, people are preferring micromobility over conventional shared mobility, as it will allow them to maintain social distancing. For example, when the stay-at-home orders were lifted in Manila, a large number of people began cycling or walking to work, instead of using public transportation services, such as buses.
The dockless category dominated the Philippines micromobility market during the last few years, and it is predicted to demonstrate the faster growth in the forthcoming years as well, within the sharing system segment. The dockless sharing system is being increasingly adopted by market players on account of the rising preference of customers for it over the docked system. This is because the vehicles deployed via such systems can be picked up and dropped off anywhere.
Key Findings of Philippines Micromobility Market Report
• Soaring demand for greener environment biggest market driver
• Micromobility providing better first- and last-mile connectivity
• Popularity of e-mopeds was highest in past
• Adoption of dockless sharing systems will surge
• Micromobility service providers adopting electric vehicles
• Market players focusing on service expansion
U.S. Automotive Tire Market To Prosper Exponentially till 2024
During the forecast period of 2019–2024, the U.S. automotive tire market is expected to witness growth at a 5.4% CAGR. It stood at $57.9 billion in 2018, and it is projected to register a significant increase in its revenue to $75.4 billion by 2024. This growth can be attributed to the expanding automobile industry and high rate of tire replacement, due to constant innovations and an aim to increase the average lifespan of vehicles. Additionally, electric vehicles (EVs) have widened the scope for the market with new and environment-friendly mobility options. There has been a surge in the demand for lightweight automobiles and EVs in the U.S. With their increasing sales volume, the expanding automobile industry has enhanced the growth prospects for the U.S. automotive tire market. The U.S. is home to several automobile manufacturers, who are consistently focusing on innovations. The demand for low-emission vehicles has led to the engineering of modified, lightweight tires, which are custom-made by original equipment manufacturers (OEMs). The tire industry is, thus, advancing with the expansion in the automobile sector. These newly developed tires also help in energy saving and offer a smooth driving experience.
The U.S. automotive tire market can be further categorized based on design into radial and bias tires, under the design segment. Of these, radial tires held the large share of the market in 2018, and they are predicted to continue doing so during 2019–2024. The durability quotient of radial tires makes them more viable than bias tires. In addition, the former are sturdier due to the presence of perpendicular polyester piles and crisscrossed steel belts, therefore, will witness an even higher market demand in the future.
The multi-faceted tire industry offers tires that break the constraints of seasons as well. Therefore, based on type, the market can be divided into winter, summer, and all-season tires. Among these, the U.S. automotive tire market was dominated by all-season tires in recent years. With the increasing availability of these tires, the demand for season-specific tires has substantially gone down. All-season tires are a much more viable option, which is why their sales are projected to grow multifold till 2024.
There has been a surge in the demand for lightweight automobiles and EVs in the U.S. With their increasing sales volume, the expanding automobile industry has enhanced the growth prospects for the U.S. automotive tire market. The U.S. is home to several automobile manufacturers, who are consistently focusing on innovations. The demand for low-emission vehicles has led to the engineering of modified, lightweight tires, which are custom-made by original equipment manufacturers (OEMs). The tire industry is, thus, advancing with the expansion in the automobile sector. These newly developed tires also help in energy saving and offer a smooth driving experience.
The U.S. automotive tire market can be further categorized based on design into radial and bias tires, under the design segment. Of these, radial tires held the large share of the market in 2018, and they are predicted to continue doing so during 2019–2024. The durability quotient of radial tires makes them more viable than bias tires. In addition, the former are sturdier due to the presence of perpendicular polyester piles and crisscrossed steel belts, therefore, will witness an even higher market demand in the future.
The multi-faceted tire industry offers tires that break the constraints of seasons as well. Therefore, based on type, the market can be divided into winter, summer, and all-season tires. Among these, the U.S. automotive tire market was dominated by all-season tires in recent years. With the increasing availability of these tires, the demand for season-specific tires has substantially gone down. All-season tires are a much more viable option, which is why their sales are projected to grow multifold till 2024.